Debug Logs
The Debug Logs section in the Burq Connector App provides detailed logging of all transactions and activities within the system, including errors, debugging information, and other operational logs. These logs are essential for developers and system administrators to troubleshoot issues, monitor performance, and ensure data flow integrity between ERPs and e-commerce platforms.

Key Features of the Debug Logs Page
Log Table:
The logs are displayed in a structured table with the following key columns:
- Timestamp: The date and time when the log entry was recorded.
- Level: The severity or type of the log. There are three main levels:
- Error: Indicates a critical issue or failure in the transaction or process.
- Info: General information regarding normal operations.
- Debug: Detailed information for debugging purposes, typically used by developers to trace the flow of execution and identify issues.
- Logger: The specific part of the system generating the log (e.g., CONSUMER_OrderCreate, PRODUCER_OrderCancellation).
- Service: The name of the service or operation being logged, such as OrderCreate or OrderCancellation.
- Transaction ID: The unique identifier of the transaction involved, allowing users to trace logs related to a specific transaction.
- Message: The detailed log message, providing insight into what happened during the logged operation. This could include error descriptions, processing steps, or success messages.
Log Management:
- Auto Refresh: Users can enable automatic refresh to update the logs in real-time as new logs are generated.
- Manual Refresh: Allows users to manually refresh the logs for up-to-date information.
Advanced Filtering Options
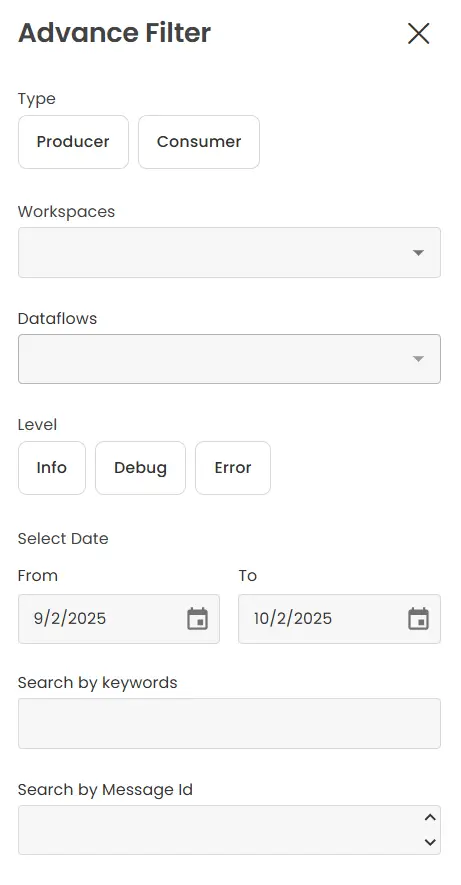
Type Filter:
- Users can filter logs based on the type of system actor, choosing between:
- Producer: Logs generated by the system or service that sends data.
- Consumer: Logs generated by the system or service that receives and processes data.
Workspaces Filter:
Filters the logs by workspaces to focus on logs related to specific ERP-platform connections (e.g., Dynamics with eBay).
Dataflows Filter:
Filters the logs by the type of dataflow, such as OrderCreate, OrderCancellation, etc.
Level Filter:
- Filters logs based on their severity or type, including:
- Info: General operation information.
- Debug: Detailed debugging logs.
- Error: Critical error logs.
Date Range Filter:
Allows users to specify a date range (From and To), which limits the logs to those generated within the defined period.
Search by Keywords:
Users can search logs by entering keywords that match content in the log messages.
Search by Message ID:
Users can filter the logs by entering a specific Message ID to find logs related to a particular transaction or operation.
Apply and Clear Filters:
- Apply Filter: Once the user has selected the relevant filters, they can apply them to the logs by clicking the “Apply Filter” button.
- Clear Filter: Clicking the “Clear Filter” button resets all filters, returning the full log view.